What’s New

Posts about what Pate Graph Analytics has been busy developing.

  • Step 3 – Automation Tooling

    It has been six months since my last post, so what have we been up to this spring and summer?

    The big change to everything is I have started working as a consultant for:

    Airelogic is an employee owned company that provides technology and innovation for the greater good working on healthcare and education systems. It is a company strongly aligned with my personal aims aims and values having worked for the NHS in the past.

    Under the Aire Logic umbrella is Aire Innovate. Aire Innovate is a service that allows the quick creation and publication of questionnaires, it allows you to build out the user journey and provides strong integration with healthcare systems, protocols. More recently AI blocks have been added. If your a healthcare provider or trust take a minute to check it out, its cool, especially if your having trouble creating healthcare questionnaires and want that data integrated with your existing records.

    Right enough of the plug about my employer, what is Pate Graph Analytics doing then your asking yourself. Is it dead now? No we are carrying on building and coding .. so what have we been up to?

    Automation Tooling

    Some of the things I aim to provide would require a level of manual work.. Just reading and checking DMARC reports that come as a compressed file in an e-mail for example. So I have been building some tooling to deal with that. These things are a problem for any business

    The design looks like this:
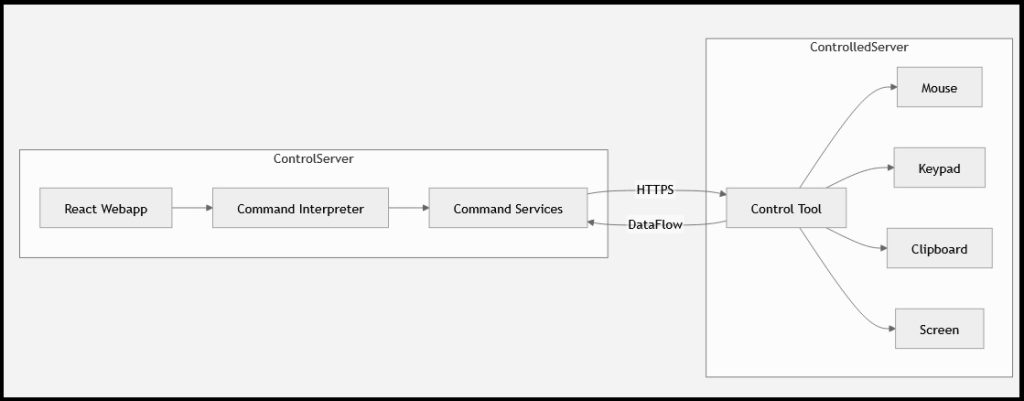
    The service allows the user to build out a series of commands that execute in a runtime. That runtime can process data internally but it is also able to reach out to a control tool which may be sat on a separate server or machine. That control tool is able to perform all the normal things a user can do on that machine following the control server’s commands. Pretty cool eh.

    Getting it doing everything I want will take me some time to complete I guess, but then I get to do less boring manual work regarding my own and more exciting analytics and development.

    If it looks like something that would fit a problem you have, drop me a line in the comments, maybe I can build it to meet your needs too.
  • Step 2 – WordPress Data Analytics

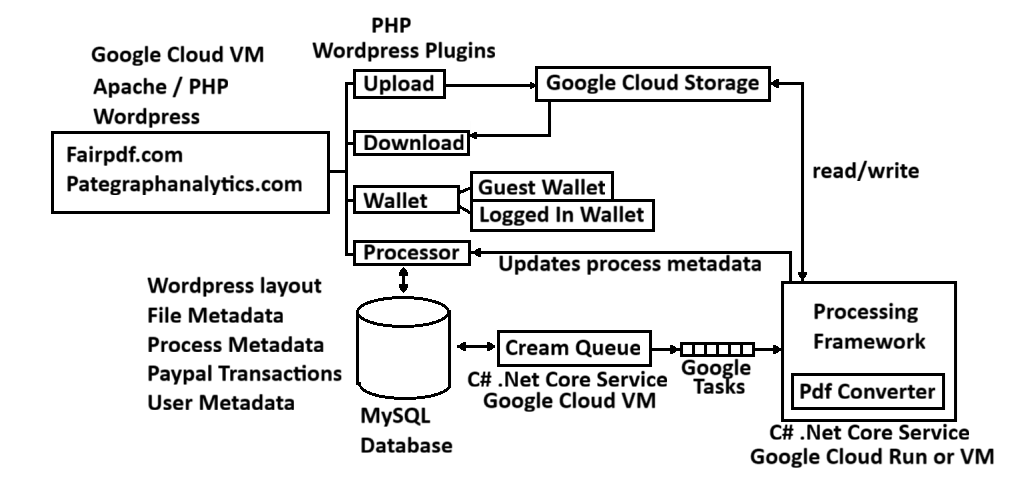
    We realised at this point we should really find a way make the web-site design as efficient and agile as possible. We wanted to come up with a way of freeing our web and UI designers to allow them to operate independently of our processing development team. This will allow us to turn-around features and get them out to you even more quickly and efficiently. This meant a complete change in the overall architecture and implementation, which we will now briefly take a look at.

    We switched to a implementing the front-end using WordPress which is a PHP based content-management framework where page content and layout is stored in a database and rendered dynamically. Now we had a relational database we might as well switch to holding all our user, file and process metadata there too.

    WordPress was initially designed for rendering blogs, but now is what is behind many e-commerce platforms such as Shopify. It does not out of the box do things we need it to do such as uploading to user files to cloud storage or list or delete those files, so we needed to write our own plugins to implement those bespoke features in PHP. We also implemented a guest wallet so users can try before they buy. On the plus side now we were using WordPress we are able to leverage popular off-the-shelf plugins to do standard things like user management and payment integration.

    Behind WordPress we have a couple of micro-services. The first is a “Cream Queue” responsible for finding new work users have generated and queuing that work fairly to our processing framework. It is also responsible for housekeeping tasks such as removing expired files.

    Following that we have a scalable processing framework which interprets the tasks and passes them to the appropriate processing module. If also provides services to the modules such as fetching files from cloud storage as well as storing the resulting files and messaging the front-end when processing has completed.

    Although our building-out has taken us a while (several months) adding a new process just requires us to write the processor for it (in any language) tweak the cream-queue config slightly. Then finally all we need to do is quickly add a new page to WordPress using our existing plugin (short-codes) that allows the user to upload files for the new process. In the coming months we will be focusing on releasing all of this and adding new processes and services.

    If there is a process you would like us to consider, please head over to our Suggestions/Feedback page and let us know.

  • Our first step – A python analytics web-service

    To start off with what we basically want is a data analytics webservice that allows users to login, upload files, allows them to create processes and then a way of charging them for that processing.

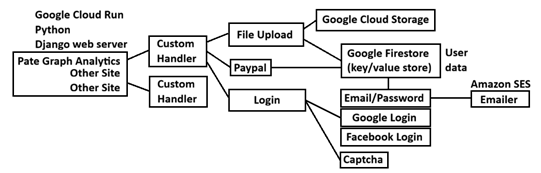
    So the service is cost-effective and scalable we began creating an implementation that could be deployed as a Google cloud run service. We chose Google Cloud as there tends to be less network configuration to deal with (compared to AWS) and we have developed with it before.

    Although we could use any language, many cloud run and cloud functions tend to be written in python, so we chose that. We first developed a framework that allows multiple sites to be handled by a single cloud run instance passing the requests to a custom handler.

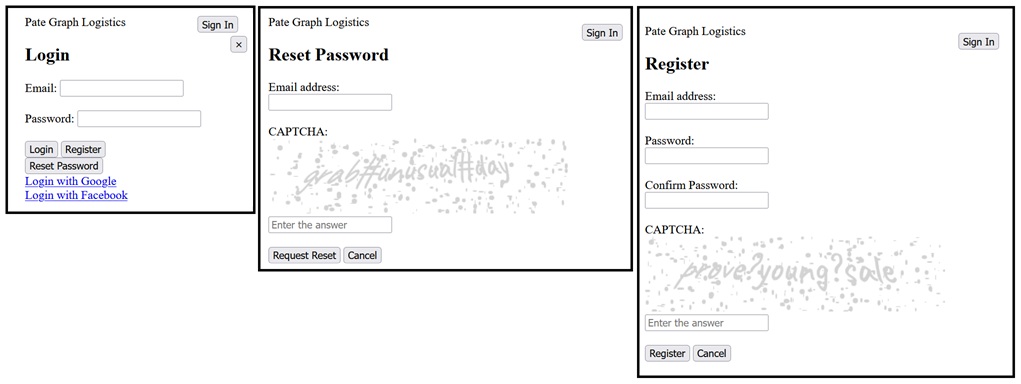
    There is more to safe user management than you think. It requires salting and hashing passwords for security, you need pages to send password resets by email and send registration emails. You do not want to allow bots to create accounts or attempt to obtain user emails by brute-force, so that required adding a captcha implementation. We also want to allow users to sign-in using their Google or Facebook accounts.

    We are ahead of the wave and use AI tools (github copilot) in our development. We do not do the trendy “vibe-coding” YouTube loves which developers have very deep concerns about, instead we incrementally plan, implement and verify each feature we come up with in order to ensure a clean cohesive structure.

    In just over a month we had developed the architecture shown at the top of this post and had a working prototype (but more work needs to be done on the HTML / CSS). We will talk more about that in our next post.

  • Defining what we are aiming to achieve.

    The first step in defining what we aim to achieve it to write a simple and clear mission statement, our is to provide:

    Online data analysis and graphing service at a fair price.

    We started with decades experience in software development across a range of languages (C, C++, Java, JavaScript, Python and C#). In addition to this we also have many years experience analysing, displaying and wrangling data in a university research environment.

    We have a capability and passion in extracting useful information from complex or poor quality data and presenting that using clear graphics or tables.

    We want to take that knowledge and experience and make it available to other small businesses, researchers and individuals. We believe this is a good thing to do. We also believe it is a niche we can focus on as other businesses in this sector are more aimed at offering larger more complex products, but these requiring the user to commit to long and expensive contracts that are not well suited to everyone.

    We are especially interested in the analysis of environmental and health data in order to improve peoples lives. Although driving efficiency and growth through analysis of business data is also something we believe improves peoples lives too.